Finding percents can be difficult for students – they are conceptually rigorous and typically found in a word problem. The solution? Strong instruction and plenty of practice. Here are a few tips and activities for calculating and finding percents.
Make Percents Visual
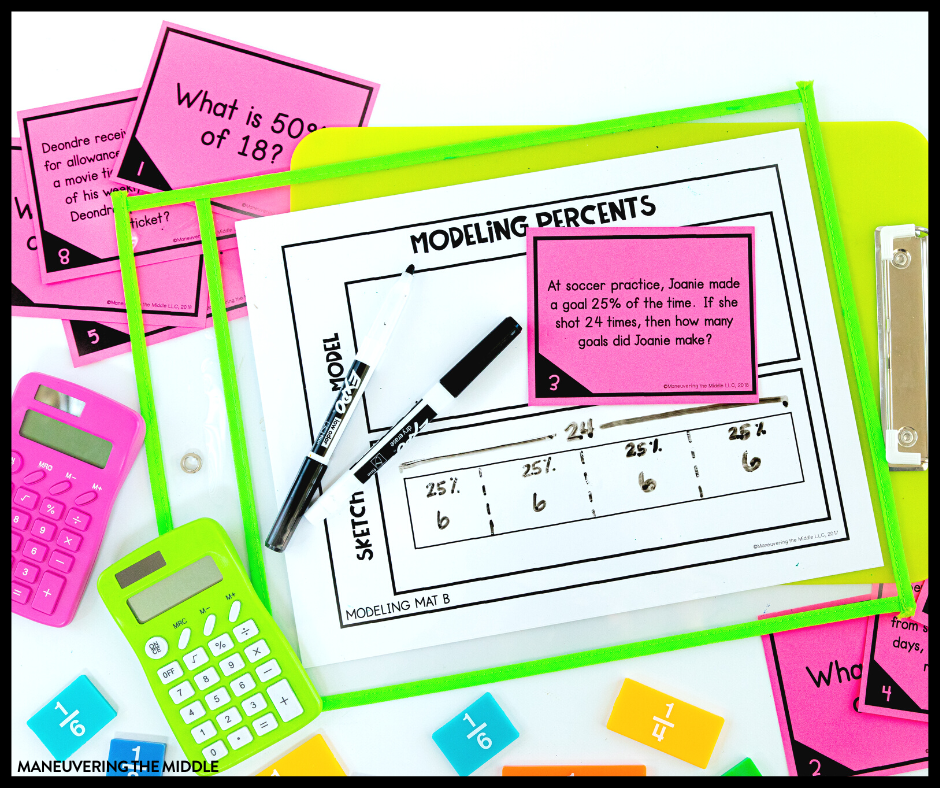
Percents are perfect for visual representation! There is no better way to do this than using a tape diagram. In fact, if you teach your students to set up a part/whole = %/100 proportion, then a tape diagram is just a picture of that exact proportion . The best part of the tape diagram visual is that students instinctively are better able to estimate answers based on using benchmark fractions like 50%. This modeling percent activity is perfect for practicing those tape diagrams!
This Interactive Fraction Model is an awesome tool for exploration! When the numerator and the denominator are manipulated, the model, decimal, and percent are changed. You can also limit the number of denominator options or adjust how the model looks.
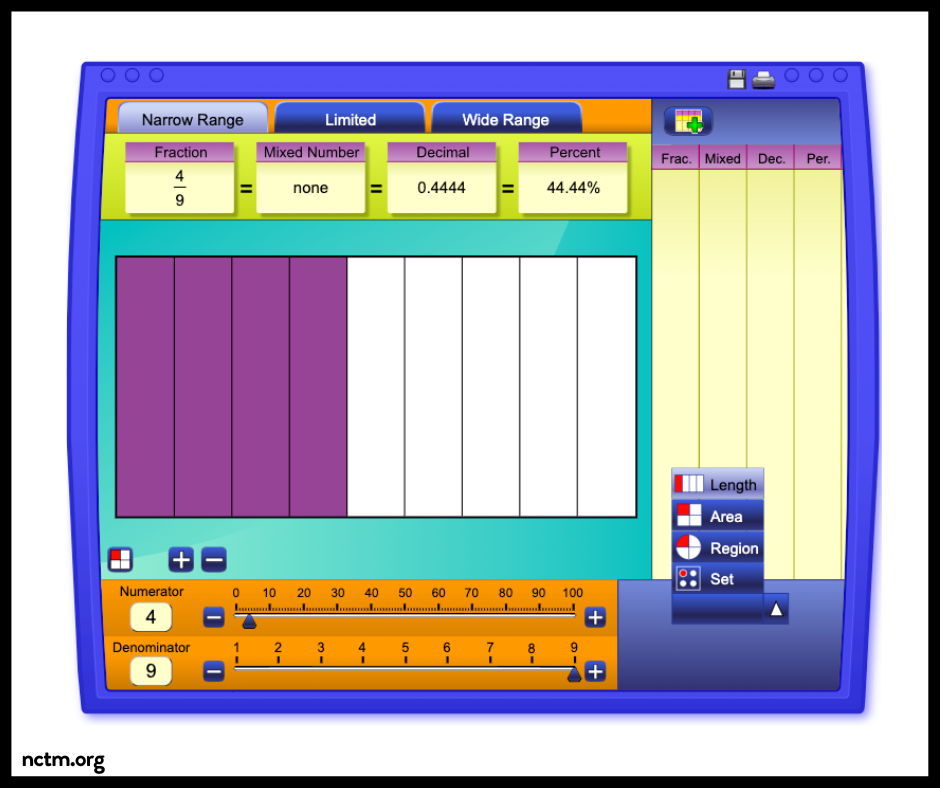
Some questions and ideas for your class:
- What do you notice about the percent when the numerator is greater than the denominator?
- What fractions give you repeating decimals?
- Give students a percent, and ask them to discover the equivalent fraction.
Bring a king size Hershey bar to class. Discuss what size it is and then draw the connection to a percent bar (aka tape diagram). Ask students to describe how many rectangles would be one-half, one-fourth, etc. Then connect this to 50%, 80%, etc.
What percent of Manhattan is Central Park? As an adult, I estimate percents more than I actually calculate or find percents, so I thought this lesson was a great way to get students to begin estimating percents. The video introduces the question, “What percent of Manhattan is made up of Central Park?” Students will have to discuss and ask questions about what information that they still need in order to solve.
Percent Application
Percents are everywhere. Introducing percents was met with a lot of buy-in from students; they have some prior experience with percents in their grades or at the store. Let’s capitalize on that interest by using as many real-world opportunities as possible.
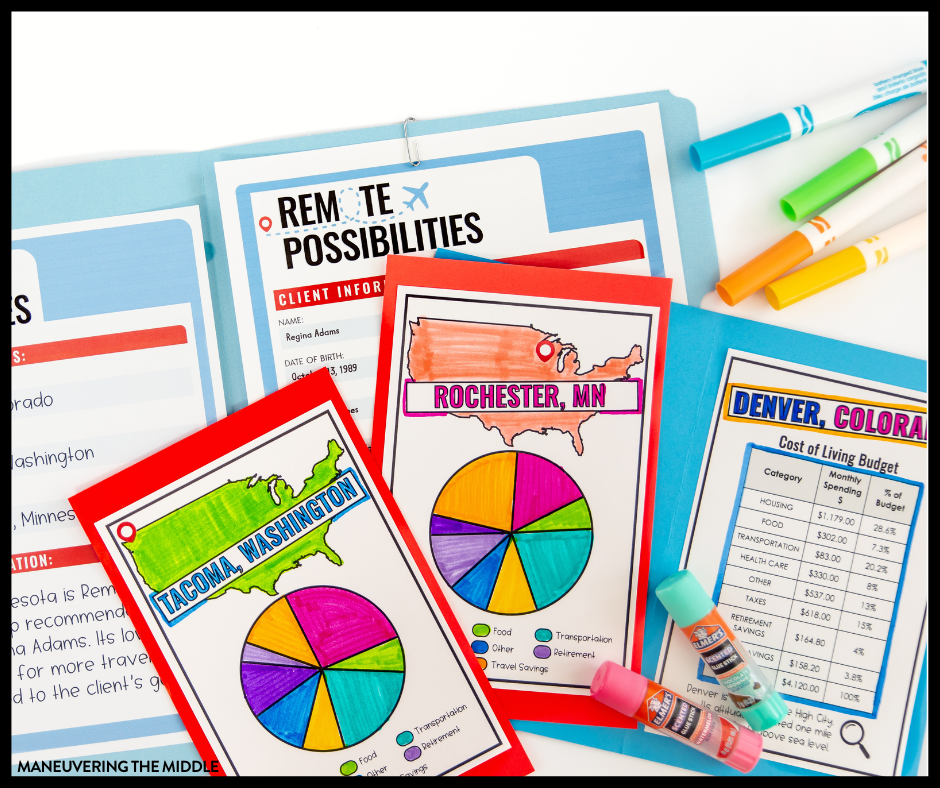
Financial Literacy + Percent Project – This project is a homerun! Students are tasked with helping their “clients” who work remotely find the best place to live based on their income, financial goals, and lifestyle. Students will use finding percents to make decisions about the best use of their client’s income.
Posing Percent Problems on Desmos – “Students apply what they’ve learned about increasing and decreasing by a percentage to generate and answer questions about the society in which we live.” This activity is more paper-based than what we traditionally see from Desmos, but it puts the responsibility on the student to determine the question. For example, a student is provided facts about wage gaps, and then asked to come up with the question and the answer based on that wage gap fact. There is opportunity for some interesting responses.
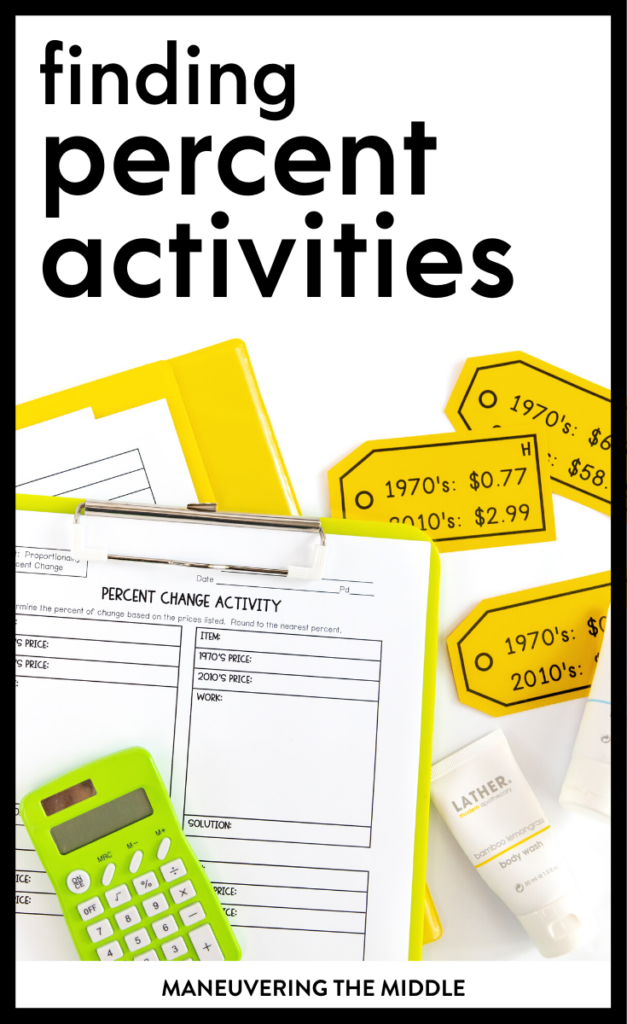
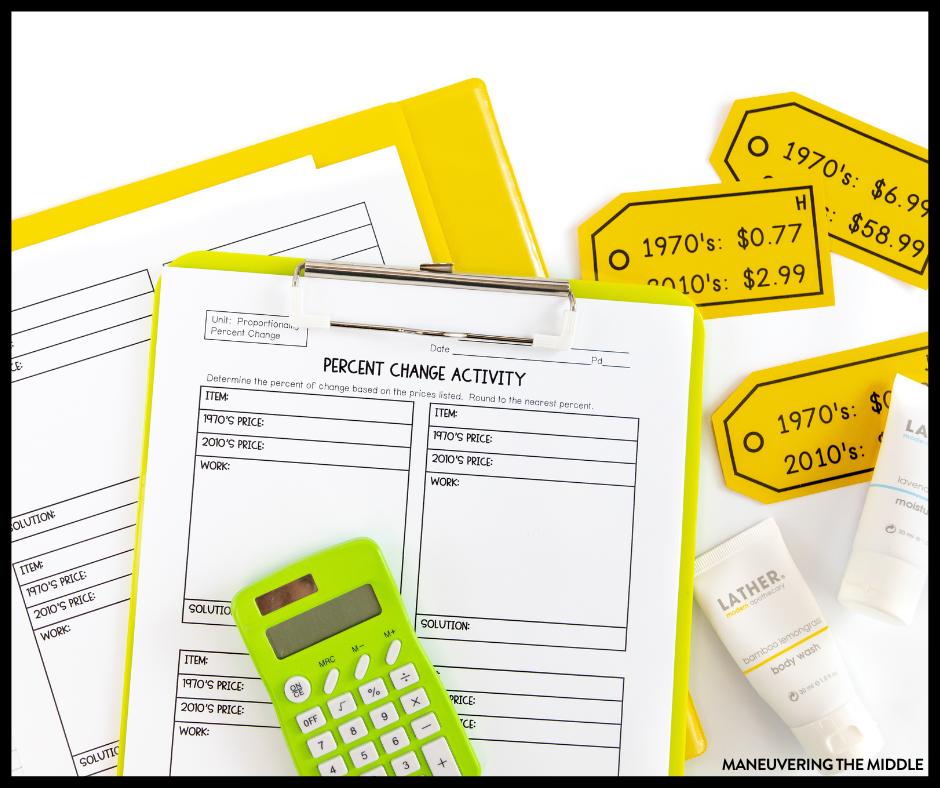
Percent of Change Class Demonstration – Check out what one of our teachers had to say about this activity:
“Today’s lesson is always one of my absolute favorites. We do the shopping activity for percent change…It not only gives the kids a bunch of practice with percent change, but gets them asking so many big questions! “Why would magazines get so expensive? Don’t they want us to read and learn?” “Why aren’t coffee prices higher? Are the coffee workers making enough money?”
General Tips
There are several ways to determine the percent of a number, including an equation, a proportion, or a tape diagram (percent bar). I suggest teaching all of the methods to see what clicks the best with your students. Additionally, I would assign some problems to only set up the problem without solving.
Consider using a similar problem and similar information to show students how to set up problems and solve for different parts of the equation/proportion.
- Example 1: A carnival is made up of 80 booths. Of those 80 booths, 14 sell food. What percentage of the booths sell food? (finding the percent)
- Example 2: At a second carnival, food booths make up 40% of the total booths. There are 16 food booths. How many total booths are at this carnival? (finding the total)
- Example: At a third carnival, there are 75 booths. 30% are food booths. How many food booths are there? (find the part)
When annotating word problems, I would require my students to write a fraction bar with 100 under any percent that they came across. This reminded students that we were going to use 100 in our solving.
FDP Everyday – Students calculate the number of days they have been at school over a total (it could be the month, number of days until the next break, or total number of school days there are) and then calculate the decimal and percent. It’s a perfect warm-up or extension activity.
If you have a Flocabulary Account, your students will enjoy this Percent rap!
What finding percents activities do your students enjoy?
