Welcome to Part 3 of our Problem Solving Strategy series! Today we are diving into helpful tape diagrams to solve problems.
If you want to learn more, check out this book, Mathematize It!, that covers the topic of teaching how to solve word problems in much more detail.
Be sure to read: Part 1: Three Word Problem Types to Teach | Part 2: Three Steps to Solving Word Problems
Diagrams are a way to model what is happening in a word problem. Diagrams help provide students with the “operational sense” that they need in order to write an equation and solve a problem. We cannot rely on keywords to determine an operation.
Let’s dive into two examples. (You can see my example of open number line diagram here.)

Tape Diagrams in a Relationship Problem
Let’s start with an example problem:
After we have restated the problem, we use a diagram to represent the problem. Notice that this tape diagram is helpful because of the whole in relation to the part.
There are 2 parts to this marching band: those in percussion and those NOT in percussion. These 2 parts will make up the total number of members in the band (this is our whole).
We also know that there are 28 in percussion, so one part is 28. That leaves the unknown value as our other “part” – those not in percussion. So we will write the variable x in our model.

And now we can use the bar model to write an equation. We can see we need to add the two parts together and set it equal to the whole, so we could write the equation x + 28 = 196.
The model helps a student develop the operational sense to write an equation with addition, but then perform subtraction to find the difference between the two values. They can see that their solution needs to be a value smaller than the total number of members.
Tape Diagrams in a Comparison Problem
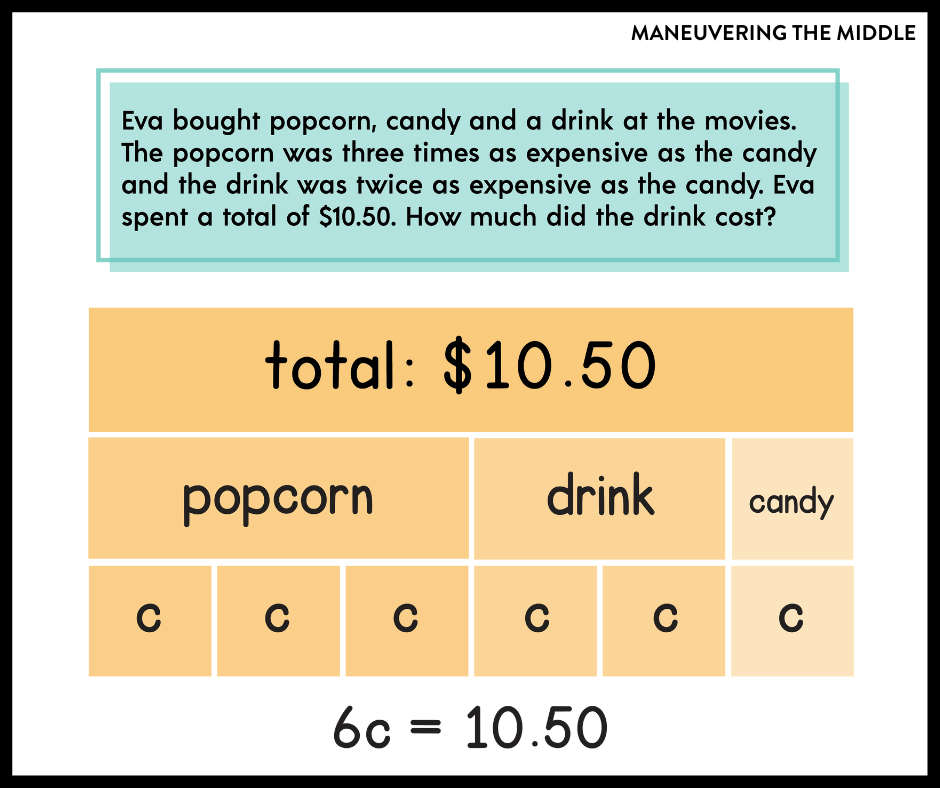
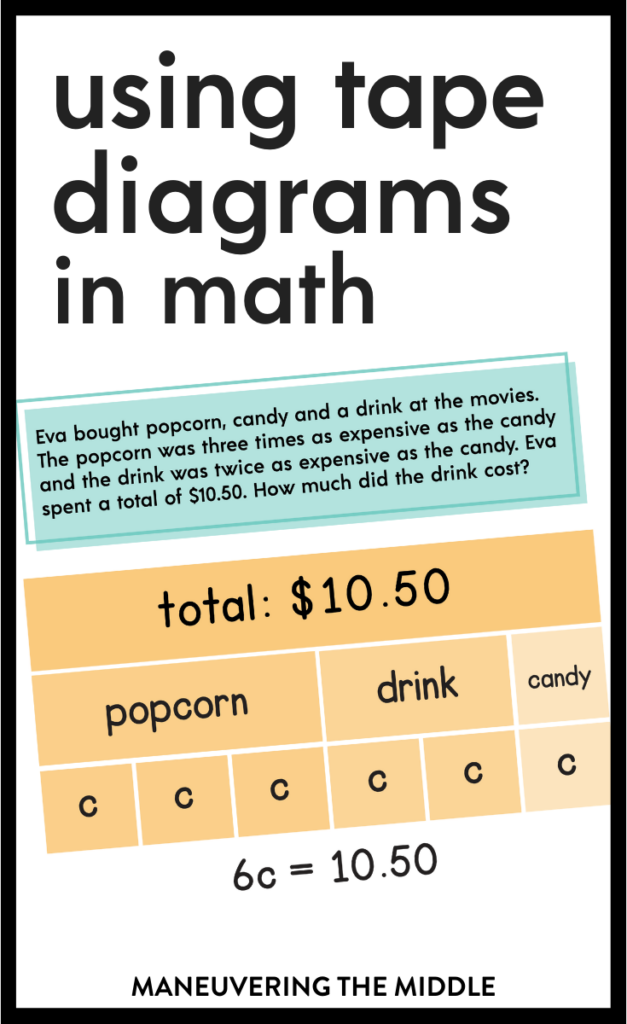
Without problem solving strategies, a student may write an equation like this, p + d + c = 10.50. They have an equation with 3 different variables and then are stuck. They don’t know how to solve for d, the price of the drink. Let’s try a tape diagram.
We know the popcorn is three times as expensive as the candy and the drink is twice as expensive as the candy. Let’s create a tape diagram under each food item in our bar model.
We know the popcorn is three times as expensive as the candy. This can be hard for students to grasp, so give them an example with simple numbers: “If candy is $1, how much is popcorn?” $3. We want students to see that popcorn is more expensive than candy and that the cost of 3 candies is equal to the cost of one popcorn.
Similarly, the drink is twice as expensive as the candy so the drink is equivalent to 2c’s.
Finally, we know the cost of the candy is represented with the variable c. Now we are ready to make a connection between our model and write an equation.
The model clearly shows that 6c = 10.50. We have taken a complex word problem and written a one-step equation to solve for the variable c. Once a student solves for the value of c, they can refer back to determine the cost of the drink and popcorn.
Grab our Problem Solving Poster freebie to display in your classroom!

How do you use tape diagrams in your classroom?
P.S. Check out these related posts: Math Problem Solving Strategies and How to Teach Word Problems and Problem Solving


